
nCounter® Analysis System
nCounter® Analysis System とは
特殊な分子バーコードを持つ配列特異的なプローブは、RNAのみでなく、断片化•変性させたDNAにもハイブリダイズさせることが可能で、DNAコピーナンバー解析にも対応します。
RNA Analysis

遺伝子発現解析

lncRNA 発現解析

Fusion Gene 発現解析
miRNA Analysis

miRNA 発現解析

miRGE™ 発現解析
DNA Analysis

コピーナンバー(CNV)解析

ChIP-String 発現解析
実験を始めやすい
プレデザインCodeSet Panelキット
Gene Expression Panels
| 製品名 | 収録遺伝子数 |
|---|---|
| PanCancer IO 360™ (Human) | 770 |
| nCounter® PanCancer Pathways(Human/Mouse) | 770 |
| nCounter® PanCancer Immune Profiling (Human/Mouse) | 770 |
| nCounter® PanCancer Progression (Human) | 770 |
| nCounter® Immunology (Human: V2/Mouse: V1) | Human 594 Mouse 561 |
| nCounter® Inflammation V2 (Human/Mouse) | Human 255 Mouse 254 |
| nCounter® Myeloid Innate Immunity V2 (Human/Mouse) | 770 |
| nCounter® Neuropathology (Human) | 770 |
| nCounter® Customer Assay Evaluation (CAE) (Human) | 48 |
nCounter® miRNA Expression Panels
| 製品名 | ターゲット数 |
|---|---|
| nCounter® miRNA Expression Assay Kits (Human: v3/Mouse: v1.5) | Human 800 Mouse 611 |
nCounter® Vantage 3D™
Gene Fusion Panels
| 製品名 | ターゲット数 |
|---|---|
| Leukemia Gene Fusion (Human) | 42 |
nCounter® DNA CNV Assays
| 製品名 | ターゲット数 |
|---|---|
| nCounter® v2 Cancer CN Assay (Human) | 87 |
※各パネルに収録されているプローブのリストは下記のURLよりダウンロードが可能です。
https://www.nanostring.com/support/product-support/support-documentation
※全てのターゲットをご指定いただくカスタムパネルのデザインも可能です。
プローブのデザインはNanoString社のインフォマティクスチームにより行います。弊社担当までご連絡ください。
※既存のパネルにご希望のターゲットを追加する【Panel Plus】や作製済みのカスタムパネルに各パネルにターゲットを追加する【CodeSet Plus】もございます。詳しくは弊社担当までお問い合わせください。
nCounter® のパフォーマンス
-
広いレンジにおけるカウント正確性
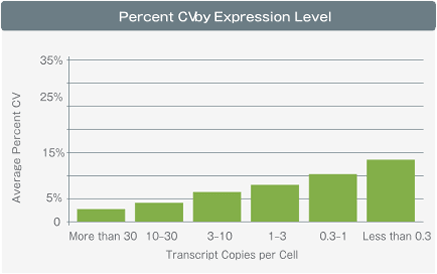
調製したRNAを発現量で分類し、各グループでのCV値を求めた結果
多くの遺伝子は1細胞あたり1コピーより少ないレベルで発現量し、CV値が15%より小さい値で測定できました。このことから、nCounter解析で定量。
Many genes were expressed at less than one transcript per cell and could be measured with less than 15% CV, allowing quantitative measurements of 2-fold changes or less. Precision increase with level of expression, in some cases allowing for quantification of less than 1.2-fold.
-
わずかな発現量の変化の検出も可能
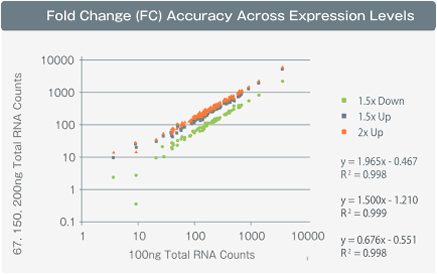
わずかな発現量の変化を検出した例
Total RNAのインプット量を67 ng、100 ng、150 ng、200 ngと変化させnCounter解析を行いました。100 ngインプット時の結果を基準にして、 67 ng (1.5x Down)、150 ng (1.5x Up)、200 ng (2x Up) のカウントをScatter Plotに図示しました。それぞれのグラフの傾きは発現量の大小に関わらず、予測通りの値(0.67、1.5、2)で高い相関が認められました。
Total RNA input amounts of 67 ng, 150 ng, and 200 ng were compared against a baseline of 100 ng. Slopes correlated closely with the expected values of 0.67, 1.5, and 2 across all levels of expression.
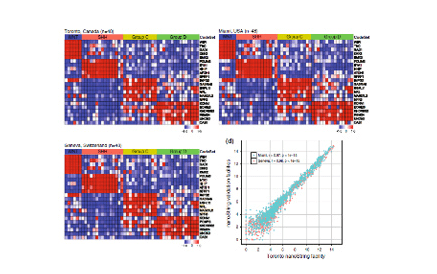
同一の髄芽腫の臨床FFPEを3つに分け、カナダ、アメリカ、スイスの3施設のnCounter®で解析した結果を比較。 いずれの施設でも同様のデータが取得できており、nCounterのデータの信頼性と再現性の高さを示しています。
R2 Site1 v Site 2 = 0.97
R2 Site1 v Site 3 = 0.98
Rapid, reliable, and reproducible molecular sub-grouping of clinical medulloblastoma samples
Northcott P.E. et al., Acta Neuropathologica; November 16, 2011
お問い合わせ
Copyright © AS ONE Corporation. All rights reserved.